| Sunspot Numbers
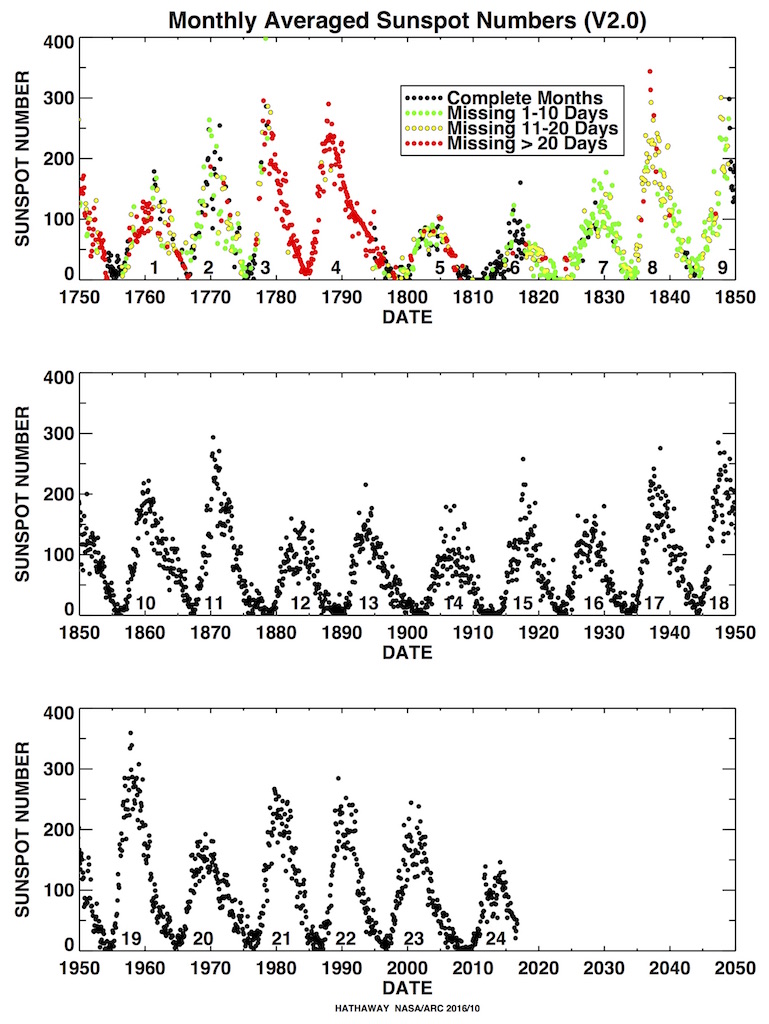
In 1610, shortly after viewing the sun with his new telescope, Galileo Galilei (or was it Thomas Harriot?) made the first European observations of Sunspots. Continuous daily observations were started at the Zurich Observatory in 1849 and earlier observations have been used to extend the records back to 1610. The sunspot number is calculated by first counting the number of sunspot groups and then the number of individual sunspots.
| ||
| The "sunspot number" is then given by the sum of the number of individual sunspots and ten times the number of groups. Since most sunspot groups have, on average, about ten spots, this formula for counting sunspots gives reliable numbers even when the observing conditions are less than ideal and small spots are hard to see. Monthly averages (updated monthly) of the sunspot numbers (181 kb JPEG image), (307 kb pdf-file), (62 kb text file) show that the number of sunspots visible on the sun waxes and wanes with an approximate 11-year cycle.
(Note: there are actually at least two "official" sunspot numbers reported. The International Sunspot Number is compiled by the Solar Influences Data Analysis Center in Belgium. The NOAA sunspot number is compiled by the US National Oceanic and Atmospheric Administration. The numbers tabulated in spot_num.txtare the monthly averages (SSN) and standard deviation (DEV) derived from the International Sunspot Numbers)
I took this white light solar image through a Baader filter on a 102mm Explore Scientific refractor right around Solar Cycle 24 maximum:

Keith Marley Sept 27, 2014
| |||
Monday, December 15, 2014
Recent sunspot activity photographed near Cycle 24 maximum
Info taken from NASA's Marshall Space Flight Center post updated 11/14/2014
Subscribe to:
Post Comments (Atom)
No comments:
Post a Comment